User Manual
Main Screen
By accessing to INGRID from your web browser, a screen like the following will be printed:
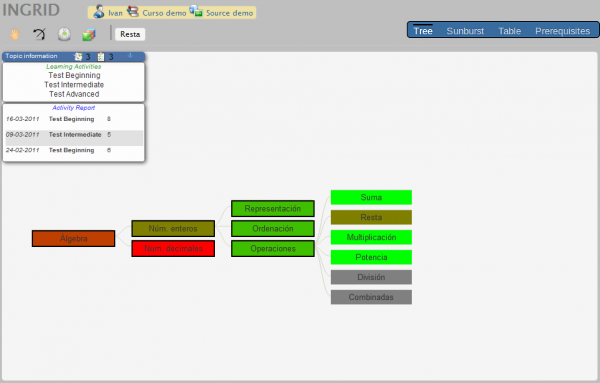
Header
In the most upper part, the header is shown, displaying the following information about the current session:
- Student
 : name of the student whose knwoledge level is being shown through the different views.
- Course
 : name of the course whose concepts are being shown through the different views.
- Source
 : e-learning system from where the information is coming.
Note: the header may not appear visible because INGRID can be configured so in order to facilitate its integration with other systems.
Options bar
Between the header and the workspace, we find the options bar, which is divided into three parts: chart tools, concept information and navigation bar.

The buttons that make the chart tools bar vary depending on the view:
- Move
 : it enables the movement within the workspace. Not available in the tabular view.
- Rotate
 : it enables to rotate horinzontally or vertically the concept tree. Only available in the hierarchical view.
- Mode

 : it allows to collapse and expand nodes in the tree or keep them all expanded. Only available in the hierarchical view.
- Legend
 : it shows the color legend used in the view. Available in all the views.
- Group

 : it allows to show and hide the comparative graph between the student and his/her class group. Only available in the tabular view.
Next to the tool buttons, it appears the name of the currently selected topic. Finally, we have three different views on the navigation bar: tree, sunburst and table, which allow us to visualize the student knowledge in different ways.
Workspace
The bottom of the screen, and the largest one, contains the workspace, where the different representation of the students knowledge, with which the user can interact to get additional information, will be shown.
Topic information panel
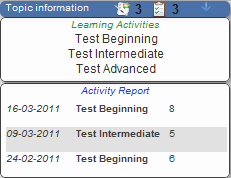
At the top left of the workspace we find the topic information panel which shows the evidences list and the actions list associated to the currently selected concept. A concept can be associated to actions, which are just links to learning activities determined by the source system.
Views
The following describes in detail each existing views to represent the student's knowledge, which will appear in the workspace.
Hierarchical view
This view represents the concept domain in a hierarquical tree (using the topic-subtopic relationship). As shown in Figure 4, each tree node represents a concept and its colour represents the knowledge level that the student has in that concept.
Hovering the mouse over a node will display a tooltip with all its related information: full concept name, level reached and a list of the activities with its date and grade.
It is possible to select a node by clicking it. By selectin a node, the diagram will be automatically centered ont that node and it will also change properly the upper label with the name of the selected concept and its associated actions. Moreover, if the selected concept has any subconcept and the expande/collapse option  is selected, that concept and its subconcepts will be shown, keeping the remaining final nodes (concepts more specific) hidden.

As noted earlier, a concept can have associated actions to which it is possible to access from the options bar if the node is selected. However, the actions of a certain concept can also be displayed and accessed by using the right mouse button on the corresponding node.
By doing this, and if the grade edition has been enabled, a contextual menu may appear. Thus, besides being able to perform the available actions, we will be able to propose a grade different to the stored one. In the latter case, a simple window will be prompt where we can choose the desired knowledge level and send ir with the appropriate button.
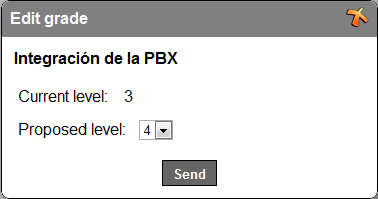
Although a grade proposal will modify the representation of the concept in each view, it is not assured that the knowledge level will change. That is the reason why a mark will appear in those concepts showing a proposal offered by the user.
Moreover, the hierarchical representation can be displayed with two different orientations, horizontal or vertical, by using the corrsponding button from the options bar  . It is likely that our tree is too large and a vertical (or horizontal) representation does not allow its full viewing. To solve this problem, you can use the scroll button
  which allows to move the workspace in any direction by only cliking and dragging on it.
Radial view
This view represents the concept domain through a circular diagram in which the inner disks represent the broader topics while the outter ones contains more specific topics. Thus, each internal sector will be related to other sectors of the outermost level.
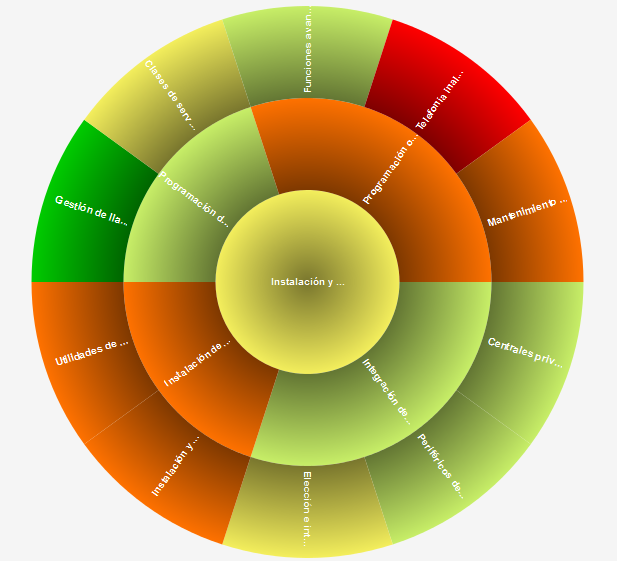
As shown in Figure 6, the sectors include the concept name and are coloured according to the student knowledge in that concept. In addition, moving the mouse cursor over any sector, detailed information of the concept will appear and clicking the right mouse button, the actions associated with the concept will be shown and even we will be able to edit the knowledge level if the option is enabled. If we click on any of the sector, its concept will remain selected and the diagram will rotate to place that sector on the right place.
As in the hierarchical view, we can move the workspace in any direction using the move tool  . This view also supports zoom by using the mouse wheel over the workspace.
Tabular view
This view represents the concept domain in a hierarquical table (using the topic-subtopic relationship). In the Figure 7 we can differentiate two panels: list of topics and detailed knowledge.

The left panel contains the list of topics and shows a table with each concept in an expandable row, grouped according to their relationships, along with the estimated knowledge level of the student in different colours.
As in the views described above, by clicking on a row we select a concept; by clicking with the right mouse button on a row we access to both the actions associated with that concept and the grade edition (if enabled) while if we hover the mouse cursor over a row we get detailed information about the concept.
The detailed knowledge panel, in the top right, shows a bar graph representing the estimated value of the student's knowledge on the selected concept in the left panel. The higher the bars, the more likely that the student has a knowledge similar to the indicated value.
The temporal knowledge panel, located under the detailed model one, shows the temporal evolution that a student have had for the selected concept. Moving the cursor over any of the bars we will get a list of activities from which the knowledge is calculated. In addition, clicking any of the bars, the detailed knowledge panel will be updated and will show the student knowledge distribution in the specific selected date.
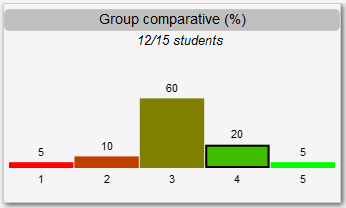
If configured so, this view will show a button in the chart tool bar which allows to show the group comparative. This option will hide the detailed and temporal knowledge panel to show a new panel (see Figure 8) representing for each concept the knowledge, as a percentage, for all the students who are part of the group (and have some data, 12 of 15 in Figure 7), marking with a black border that level in which the student knowledge fits. This way, we can compare our level and the group's.
Prerequisites view
This view presents the relationships between concepts prerequisites. In the workspace shows:
- One or more directed graphs that allows to visualize the dependency relationships between concepts;
- And on the right side a list of all topics (concepts) that have no such relationship.
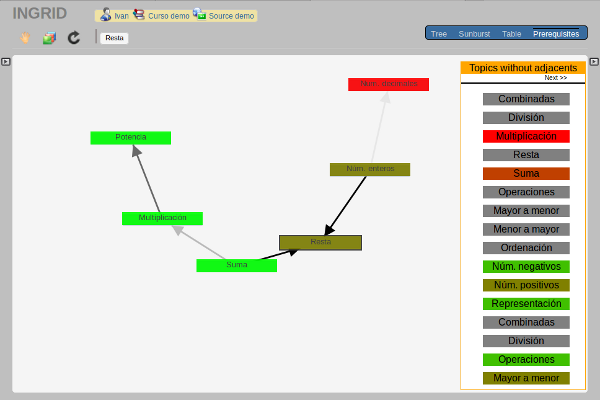
As can be observed in the Figure 9 the edges, which relates the concepts, have different colors allowing to identify the level of influence of the concept:
- black: high influence,
- dark gray: medium influence and
- gray: low influence.
When passing the mouse over any of the concepts is shown a screen with textual information about: the concept and level of knowledge and prerequisites associated with their level of influence (Figure 10).
